This web page was produced as an assignment for Genetics 564, an undergraduate capstone course at UW-Madison
Introduction
What is Transcriptomics? [1]
|
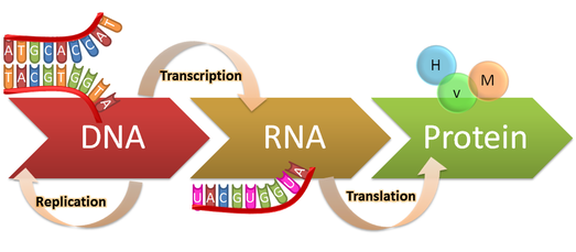
Although the genetic instructions for a protein are encoded within the DNA of a gene, they are not directly read and translated into a protein. Instead, genes are transcribed, or "copied" into messenger RNA (mRNA) transcripts, which are in turn translated into proteins by the cell's ribosomes. Interestingly, there are a large portion of RNA transcripts that do not code for a protein, known as non-coding RNA, that serve other cellular functions. All of the RNA transcripts present in a cell makeup its transcriptome, and can be useful for dissecting what genes are and aren't expressed at a given time or environmental condition[1]. Therefore, transcriptomics examines the transcriptomes of different cells, tissues, and organisms [1]. By quantifying the transcripts present in different cell types, researchers can begin to understand how different genetic regulation patterns lead to differences in a cells activity [1].
|
|
How is Gene Expression Quantified?
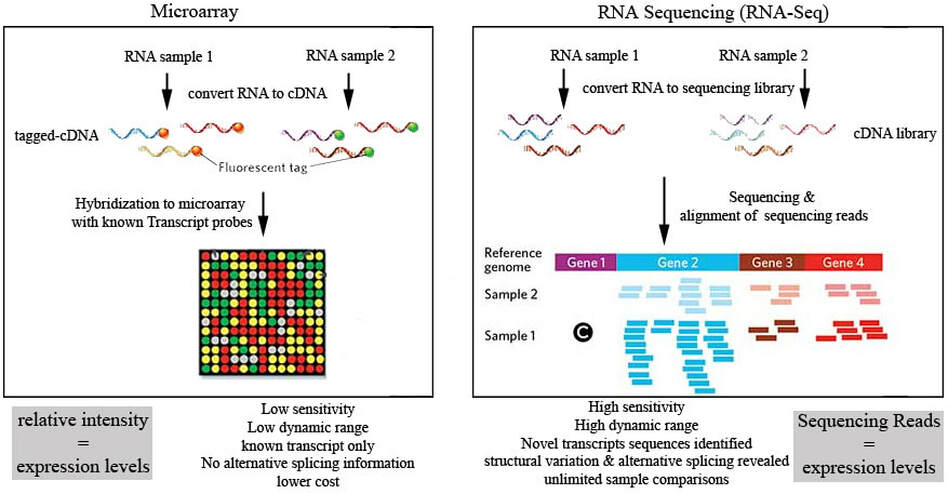
There are a number of tools for quantifying gene expression at a large scale. In fact, the Microarray and the the next-gen sequencing technique, RNA-Seq, are the two most common transcriptomic tools for quantifying gene expression at a large scale. Both of these techniques share some fundamental features. First, RNA is isolated from samples stemming from different experimental conditions. Using a special enzyme known as reverse transcriptase, a complimentary DNA strand is made using the mRNA as a template. While Microarrays and RNA-seq use different methods for actually quantifying the cDNA library that is produced from the RNA, both techniques often use fluorescent imaging to quantify a gene's expression levels. The following image explains the general steps for both Microarray and RNA-Seq experiments.
|
Microarrays are solid surfaces that contain thousands of microscopic wells, each of which contains a single unique DNA sequence called a probe. For transcriptomic analyses, the probes are often complimentary to the primary mRNA transcript for a given gene. First, RNA is isolated from each sample, and then synthesized into cDNA which are labeled with fluorescent tags to differentiate the transcripts from each condition. When the transcripts from each sample bind to a complimentary probe, their respective colors can be detected by a fluorescent camera. By taking the ratio of the two colors (red and green shown above) the relative expression of a given gene between the two conditions can be computed. For a great example please visit http://gcat.davidson.edu/DGPB/clust/background.htm. Unfortunately, there are some disadvantages to using microarrays, namely the inability to quantify alternatively spliced transcripts and novel transcripts, and thus limiting the scope of the tool to known isoforms.
|
RNA-Sequencing uses next-gen sequencing technology to quantify the expression of multiple transcripts corresponding to a single gene. First cDNA libraries are constructed from RNA isolated from multiple samples, often consisting of multiple technical replicates. Common types of RNA-Seq methods include Illumina and Ion Torrent, both of which utilize a sequencing by synthesis approach. After reads are constructed using these sequencing methodologies, they are then aligned to a reference genome or transcriptome assembly. These alignments are then converted into normalized "counts" which indicate the number of transcripts present for a given gene. Statistical tools, such as EdgeR or DESeq2, are then used to determine if the counts are significantly different between any samples. RNA-seq has a number of advantages over microarrays, namely its sensitivity and the ability to identify alternative splicing and novel transcripts. However, one must consider the cost-effectiveness of either approach, as RNA-seq is more expensive and requires high quality RNA isolates.
|
Note: If you are interested in learning more about transcriptomics or would like an opportunity to analyze real-world spaceflight gene expression data, please contact [email protected] for an opportunity to conduct your own bioinformatics research!
How are Differentially Expressed Genes Idenitified?
|
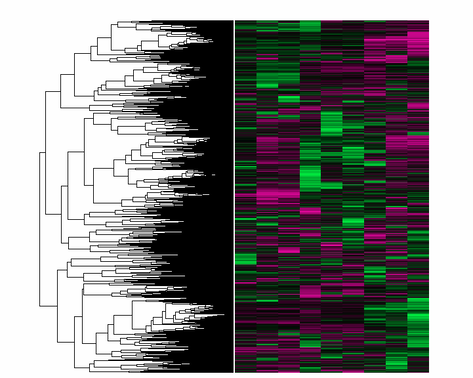
Researchers often use a method known as hierarchical clustering to identify genes that share similar expression patterns in a given cell type or stimulus. For example, as a researcher I may want to identify genes that are coexpressed in response to heat stress, or rather what genes are repressed in response to that stimulus. While there are a number of different statistical techniques used for clustering, I will describe one of the more commonly used methods I have used in my own research. To do this every gene present in the data is compared to one another to generate a Pearson correlation coefficient (1 - correlation coefficent), and genes with alike Pearson Correlation Coefficients are then grouped together graphically into dendrogram clusters [2]. An example is shown below and to the right. |
|
Results
Expression of RAD51D Across Different Tissues
The above slideshow contains RAD51D gene expression data obtained from both the Human Protein Atlas and NCBI.
Is Ovarian RAD51D Expression affected by Steroid Hormone Signaling?
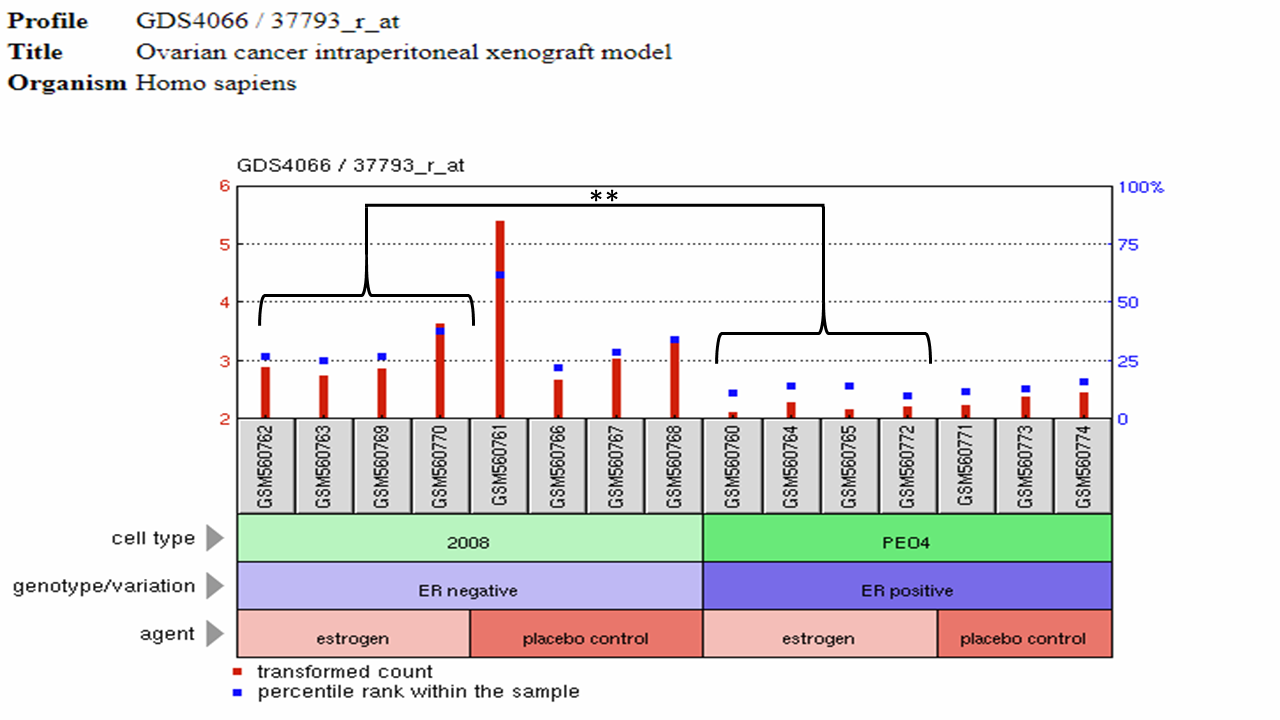
The above data was obtained from the following study: Ovarian cancer intraperitoneal xenograft model. The study used two Ovarian cancer cell lines, one of which expresses an estrogen receptor that can bind the hormone estrogen (ER+PE04), while the other doesn't express an estrogen receptor (ER-2008). These human cell types were then implanted into live mice using a technique known as Xenografting. Using the data obtained from this GEO profile, independent two-sample t-tests were performed using Vassarstats. The transformed counts of the ER-Negative cells exposed to estrogen was significantly different (p = 0.0065) from those originating from the ER-positive cell line. These results suggest that RAD51D may be down-regulated in response to estrogen exposure. NOTE: GSM60770 was not greater than two times the standard deviation of the placebo control, and therefore was not an outlier.
Genes Coexpressed with RAD51D during Ovarian Cancer Development
In order to identify what genes are coexpressed with RAD51D in ovarian carcinomas, NCBI's GEO Datasets was used to identify gene expression datasets associated with ovarian cancer (search query: "Ovarian Cancer"). Four clusters of genes coexpressed with RAD51D during ovarian cancer development in a mouse model was identified in the following dataset: MOSE Model of Ovarian Cancer Progression: Epithelial Cells. The identified genes from all four clusters were then combined for a total of 197 coexpressed genes. Finally, GO terms associated with the 197 genes were then identified using the PANTHER DATABASE. The results are displayed in the slideshow below.
Conclusions
Transcriptomic analyses from multiple sources show that there is high expression of RAD51D in ovarian tissues, consistent with its role in helping to facilitate meiosis and homology directed repair. However, there are plenty of other tissues with comparable levels of RAD51D expression, demonstrating that RAD51D expression alone cannot explain why mutations in RAD51D favor ovarian cancer. Furthermore, its interesting to note that the Ovarian Xenograft Model dataset suggests that estrogen may regulate RAD51D expression. In the study, the expression levels of RAD51D was significantly different between a ER+ and ER- cell type when exposed to estrogen, but not when exposed to a placebo, demonstrating that the cell line itself didn't alter RAD51D expression, but that the steroid estrogen correlated with lower RAD51D expression in the ER+ cells. Finally, RAD51D is coexpressed with a number of genes during ovarian cancer development, many of which are involved in different hormone signaling pathways and interactions with known tumor suppressor genes. Yet it was surprising to see that there were a number of genes involved in neurological pathways, including alzheimers and huntingtons, which draw interesting similarities to phenotypes observed in mice with RAD51D mutations. These results suggest that RAD51D may have additional roles in controlling cell cycle regulation, and signal transduction.
References
1. National Human Genome Research Institute. Transcriptome (2017). Retrieved from https://www.genome.gov/13014330/transcriptome-fact-sheet/
2. Davidson College. Background. Retrieved from http://gcat.davidson.edu/DGPB/clust/background.htm
References - Images
Background: http://www.mohrkeg.co.at/?service=cardiology
| coexpressed_with_rad51d_ovarian_cancer.txt |
